Debugging Android NullPointer Exceptions
A lot of the errors that you will get while writing programs in Java to run on Android will be NullPointer exceptions. They are easy to debug with the tools that Eclipse and ADT give you. If you resume the suspended Hello World Program we left in the last post you will get a NullPointer Exception and be returned to the debug perspective of Eclipse.
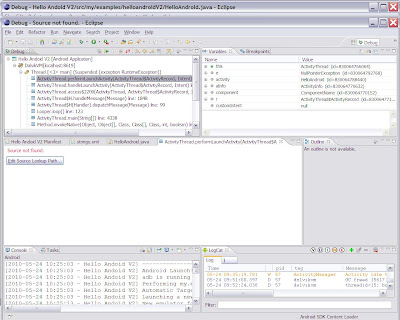
In the debug window, you will see the call stack starts with Thread [<3> main] (Suspended (exception RuntimeException)) – giving you a clear indication of the cause of the runtime error. If you click on the top stack frame icon(horizonal blue bars) in the variables window you will see a grey circle labelled e with value Nullpointer Exception – again giving you a clear indication of the error.
The Java source code window is blank, because the tab is showing code relevant to the stack frame which is inside the Dalvik virtual machine and not displayed. If you click on the hello android tab in this window you will see that line 13 is still highlighted as the exception was caused by this line and occurred before the following line could be executed.
This example is rather artificial in that you set a breakpoint on the line causing the run-time exception. In a real world example you are unlikely to have put a breakpoint on the line causing the problem. In this situation LogCat is your most powerful tool. Try running the “hello world” program in run rather than debug mode. You will get the same error message on the screen of the emulator.
Now choose the DDMS perspective in Eclipse and click on the emulator in the top left-hand window. You should get the following screen.
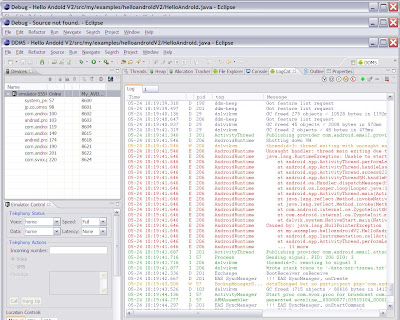
You will see a lot of red lines in LogCat. These are messages that have the severity of error, shown by the uppercase E in column 2. The first two are:
Now look down the error messages and you will see a message:
Next we will be exploring the Notepad tutirial.

In the debug window, you will see the call stack starts with Thread [<3> main] (Suspended (exception RuntimeException)) – giving you a clear indication of the cause of the runtime error. If you click on the top stack frame icon(horizonal blue bars) in the variables window you will see a grey circle labelled e with value Nullpointer Exception – again giving you a clear indication of the error.
The Java source code window is blank, because the tab is showing code relevant to the stack frame which is inside the Dalvik virtual machine and not displayed. If you click on the hello android tab in this window you will see that line 13 is still highlighted as the exception was caused by this line and occurred before the following line could be executed.
This example is rather artificial in that you set a breakpoint on the line causing the run-time exception. In a real world example you are unlikely to have put a breakpoint on the line causing the problem. In this situation LogCat is your most powerful tool. Try running the “hello world” program in run rather than debug mode. You will get the same error message on the screen of the emulator.
Now choose the DDMS perspective in Eclipse and click on the emulator in the top left-hand window. You should get the following screen.

You will see a lot of red lines in LogCat. These are messages that have the severity of error, shown by the uppercase E in column 2. The first two are:
05-24 10:19:41.546: ERROR/AndroidRuntime(206): Uncaught handler: thread main exiting due to uncaught exceptionThese make it pretty clear that the runtime error is a Nullpointer Exception.
05-24 10:19:41.646: ERROR/AndroidRuntime(206): java.lang.RuntimeException: Unable to start activity ComponentInfo{my.examples.helloandroidV2/my.examples.helloandroidV2.HelloAndroid}: java.lang.NullPointerException
Now look down the error messages and you will see a message:
05-24 10:19:41.646: ERROR/AndroidRuntime(206): Caused by: java.lang.NullPointerExceptionAnd the one below is:
05-24 10:19:41.646: ERROR/AndroidRuntime(206): at my.examples.helloandroidV2.HelloAndroid.onCreate(HelloAndroid.java:13)So whenever there is a Nullpointer exception DDMS and LogCat are going to make it straightforward to determine the relevant line of code. Now all you have to do is determine which object or variable on this line is null. Switch to debug perspective and you will see Eclipse is giving you plenty of clues. The relevant line is highlighted and has a yellow warning triangle on its left. Hovering over this gives the warning:
- Null pointer access: The variable o can only be null at this locationThe object o has a yellow wavy line under it, and hovering over it gives the same warning.
Next we will be exploring the Notepad tutirial.
Comments
Post a Comment