The Android Hello World tutorial (part 2)
If you are continuing to follow the android tutorial, you will now be creating a new hello world program that defines its string inside the strings.xml file rather than inside the helloAndroid class.
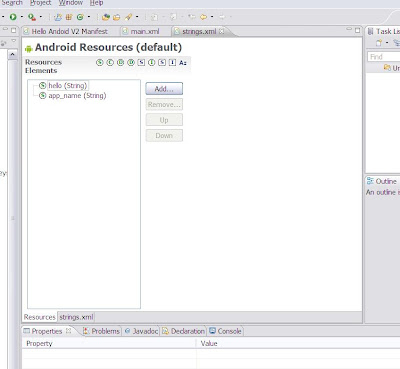
In the tutorial you write XML directly. I found that it was easy to make errors. Luckily the Android Debug Tools (ADT) Eclipse plug-in means that you often don’t have to write XML. For example if you double click on the strings.xml file in the res/layout directory, Eclipse will open a window on the xml file. If you click on the resources tab at the bottom of the window you can add, edit, delete and reorder strings without having to worry about matching your start and end tags etc.
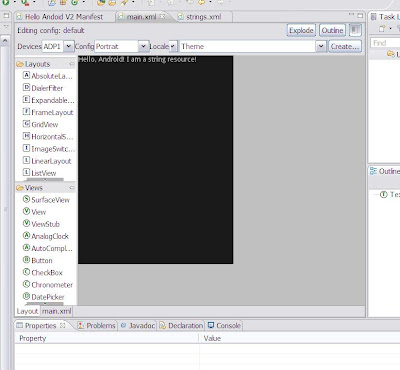
If you do the same to the main.xml file in the res/layout directory Eclipse will show you the resulting string drawn on the device screen.
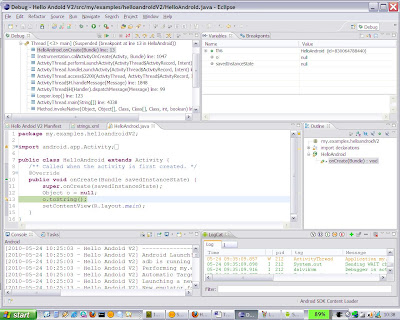
The tutorial ends by deliberately creating a null pointer exception and showing how to create a breakpoint. If you run the program in debug mode with a breakpoint set on line 13 as specified Eclipse will stop execution at the breakpoint. It is worth looking at all the information the Eclipse and the ADT plug-in are giving you.
Eclipse organises its user interface using perspectives. A perspective is a set of windows and editors. In this case Eclipse will be in debug perspective as shown by the label in the upper right corner of the screen. The upper left window will be the debug window. This has a call stack showing that the main thread of “hello world” is suspended at line 13. The lines with three horizontal blue bars represent stack frames. If you click on one, the window to the right will show the corresponding values in its values tab. The other tab shows the current breakpoints and enables you to enable or disable them.
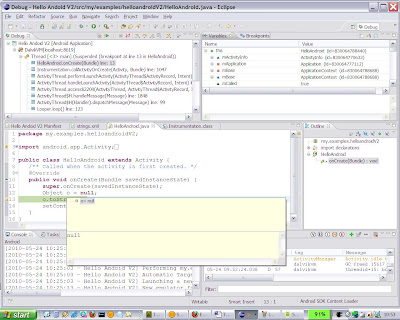
The window below this shows the Java source code, with the line we have broken at highlighted. If you hover your mouse over the object o, Eclipse will report its current value as shown below.
The bottom two windows are the console and LogCat. Neither are displaying anything interesting at the moment. From this suspended state you can step through the code using F6 or resume using F8 (or the relevant buttons just above the debug window).
In the next post we will explore debugging NullPointer exceptions in a little more detail.
In the tutorial you write XML directly. I found that it was easy to make errors. Luckily the Android Debug Tools (ADT) Eclipse plug-in means that you often don’t have to write XML. For example if you double click on the strings.xml file in the res/layout directory, Eclipse will open a window on the xml file. If you click on the resources tab at the bottom of the window you can add, edit, delete and reorder strings without having to worry about matching your start and end tags etc.

If you do the same to the main.xml file in the res/layout directory Eclipse will show you the resulting string drawn on the device screen.

The tutorial ends by deliberately creating a null pointer exception and showing how to create a breakpoint. If you run the program in debug mode with a breakpoint set on line 13 as specified Eclipse will stop execution at the breakpoint. It is worth looking at all the information the Eclipse and the ADT plug-in are giving you.
Eclipse organises its user interface using perspectives. A perspective is a set of windows and editors. In this case Eclipse will be in debug perspective as shown by the label in the upper right corner of the screen. The upper left window will be the debug window. This has a call stack showing that the main thread of “hello world” is suspended at line 13. The lines with three horizontal blue bars represent stack frames. If you click on one, the window to the right will show the corresponding values in its values tab. The other tab shows the current breakpoints and enables you to enable or disable them.

The window below this shows the Java source code, with the line we have broken at highlighted. If you hover your mouse over the object o, Eclipse will report its current value as shown below.

The bottom two windows are the console and LogCat. Neither are displaying anything interesting at the moment. From this suspended state you can step through the code using F6 or resume using F8 (or the relevant buttons just above the debug window).
In the next post we will explore debugging NullPointer exceptions in a little more detail.
Comments
Post a Comment